
Inequality Paradox
Inequality: surprising facts, dilemmas and trade-offs


We just left Thanksgiving behind and we’re barely two weeks away from Christmas — an appropriate time to reflect on economic inequality. Assessing inequality is fraught with analytical and ethical challenges. Here I want to highlight some facts, surprising results and hard questions. If you’re short on time you’ll find five takeaways at the end — but then you’ll want to come back here and read it all anyway… If you want to get into the weeds, read the footnotes.
Before and after
The most common measure of inequality is the Gini coefficient, where 0 corresponds to perfect equality — everyone has the same income — and 1 to maximum inequality, when one person has all the income. What income? There are two distinct measures:
Market income: what people earn from work or capital (OECD definition);
Disposable income: what people can spend, defined as market income minus direct taxes and social security contributions, plus social transfers.
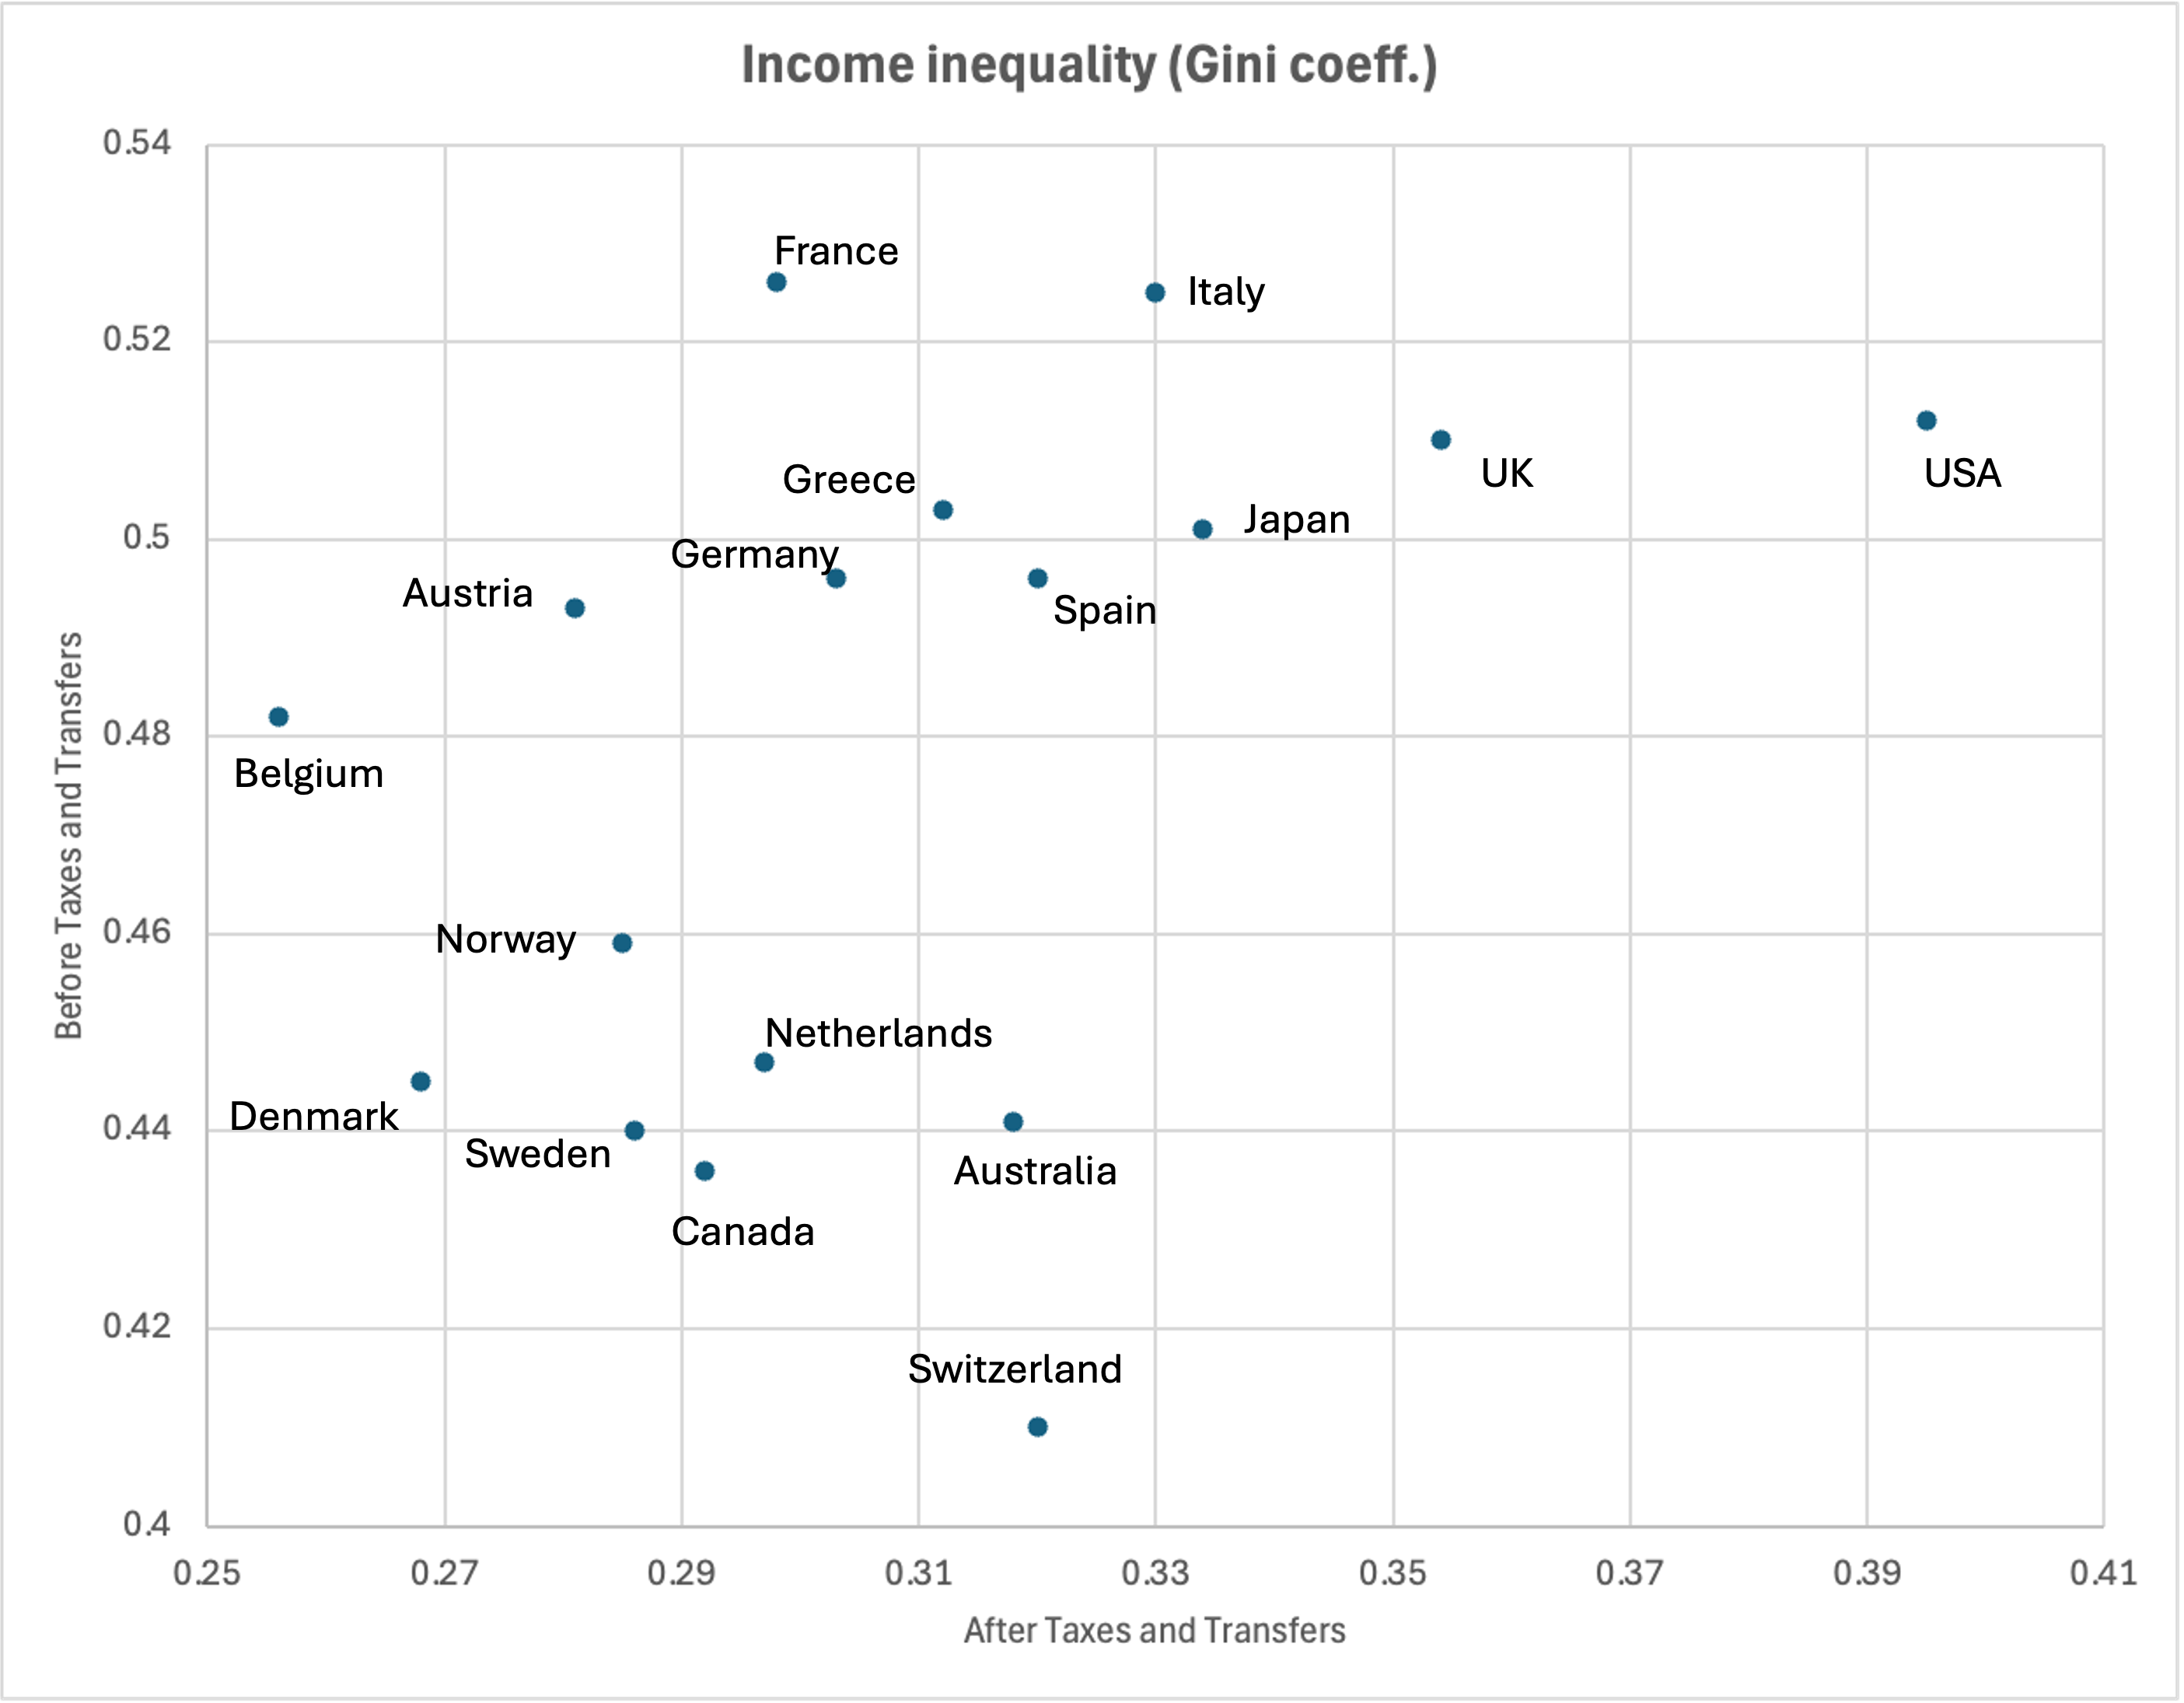
Source: OECD via Our World in Data
Among peer countries, the US has one of the highest levels of inequality both before and after taxes and transfers. You would expect the US market system to deliver a much more unequal distribution of incomes from work and capital than any European country, but inequality of market incomes here is higher in France and Italy and not much lower in Germany and Spain. Surprising, no? I’ll come back to this later.
Inequality rising?
Has US income inequality increased over the past decades?
Before you answer, ‘duh!’, look at the next chart:

Source: Congressional Budget Office, “Trends in the Distribution of Household Income From 1979 to 2021”, September 2024.
Inequality of market incomes has increased since 1979. After taxes and transfers, however, inequality is unchanged since 2000, and not that much higher than in the 1990s. Which means that…
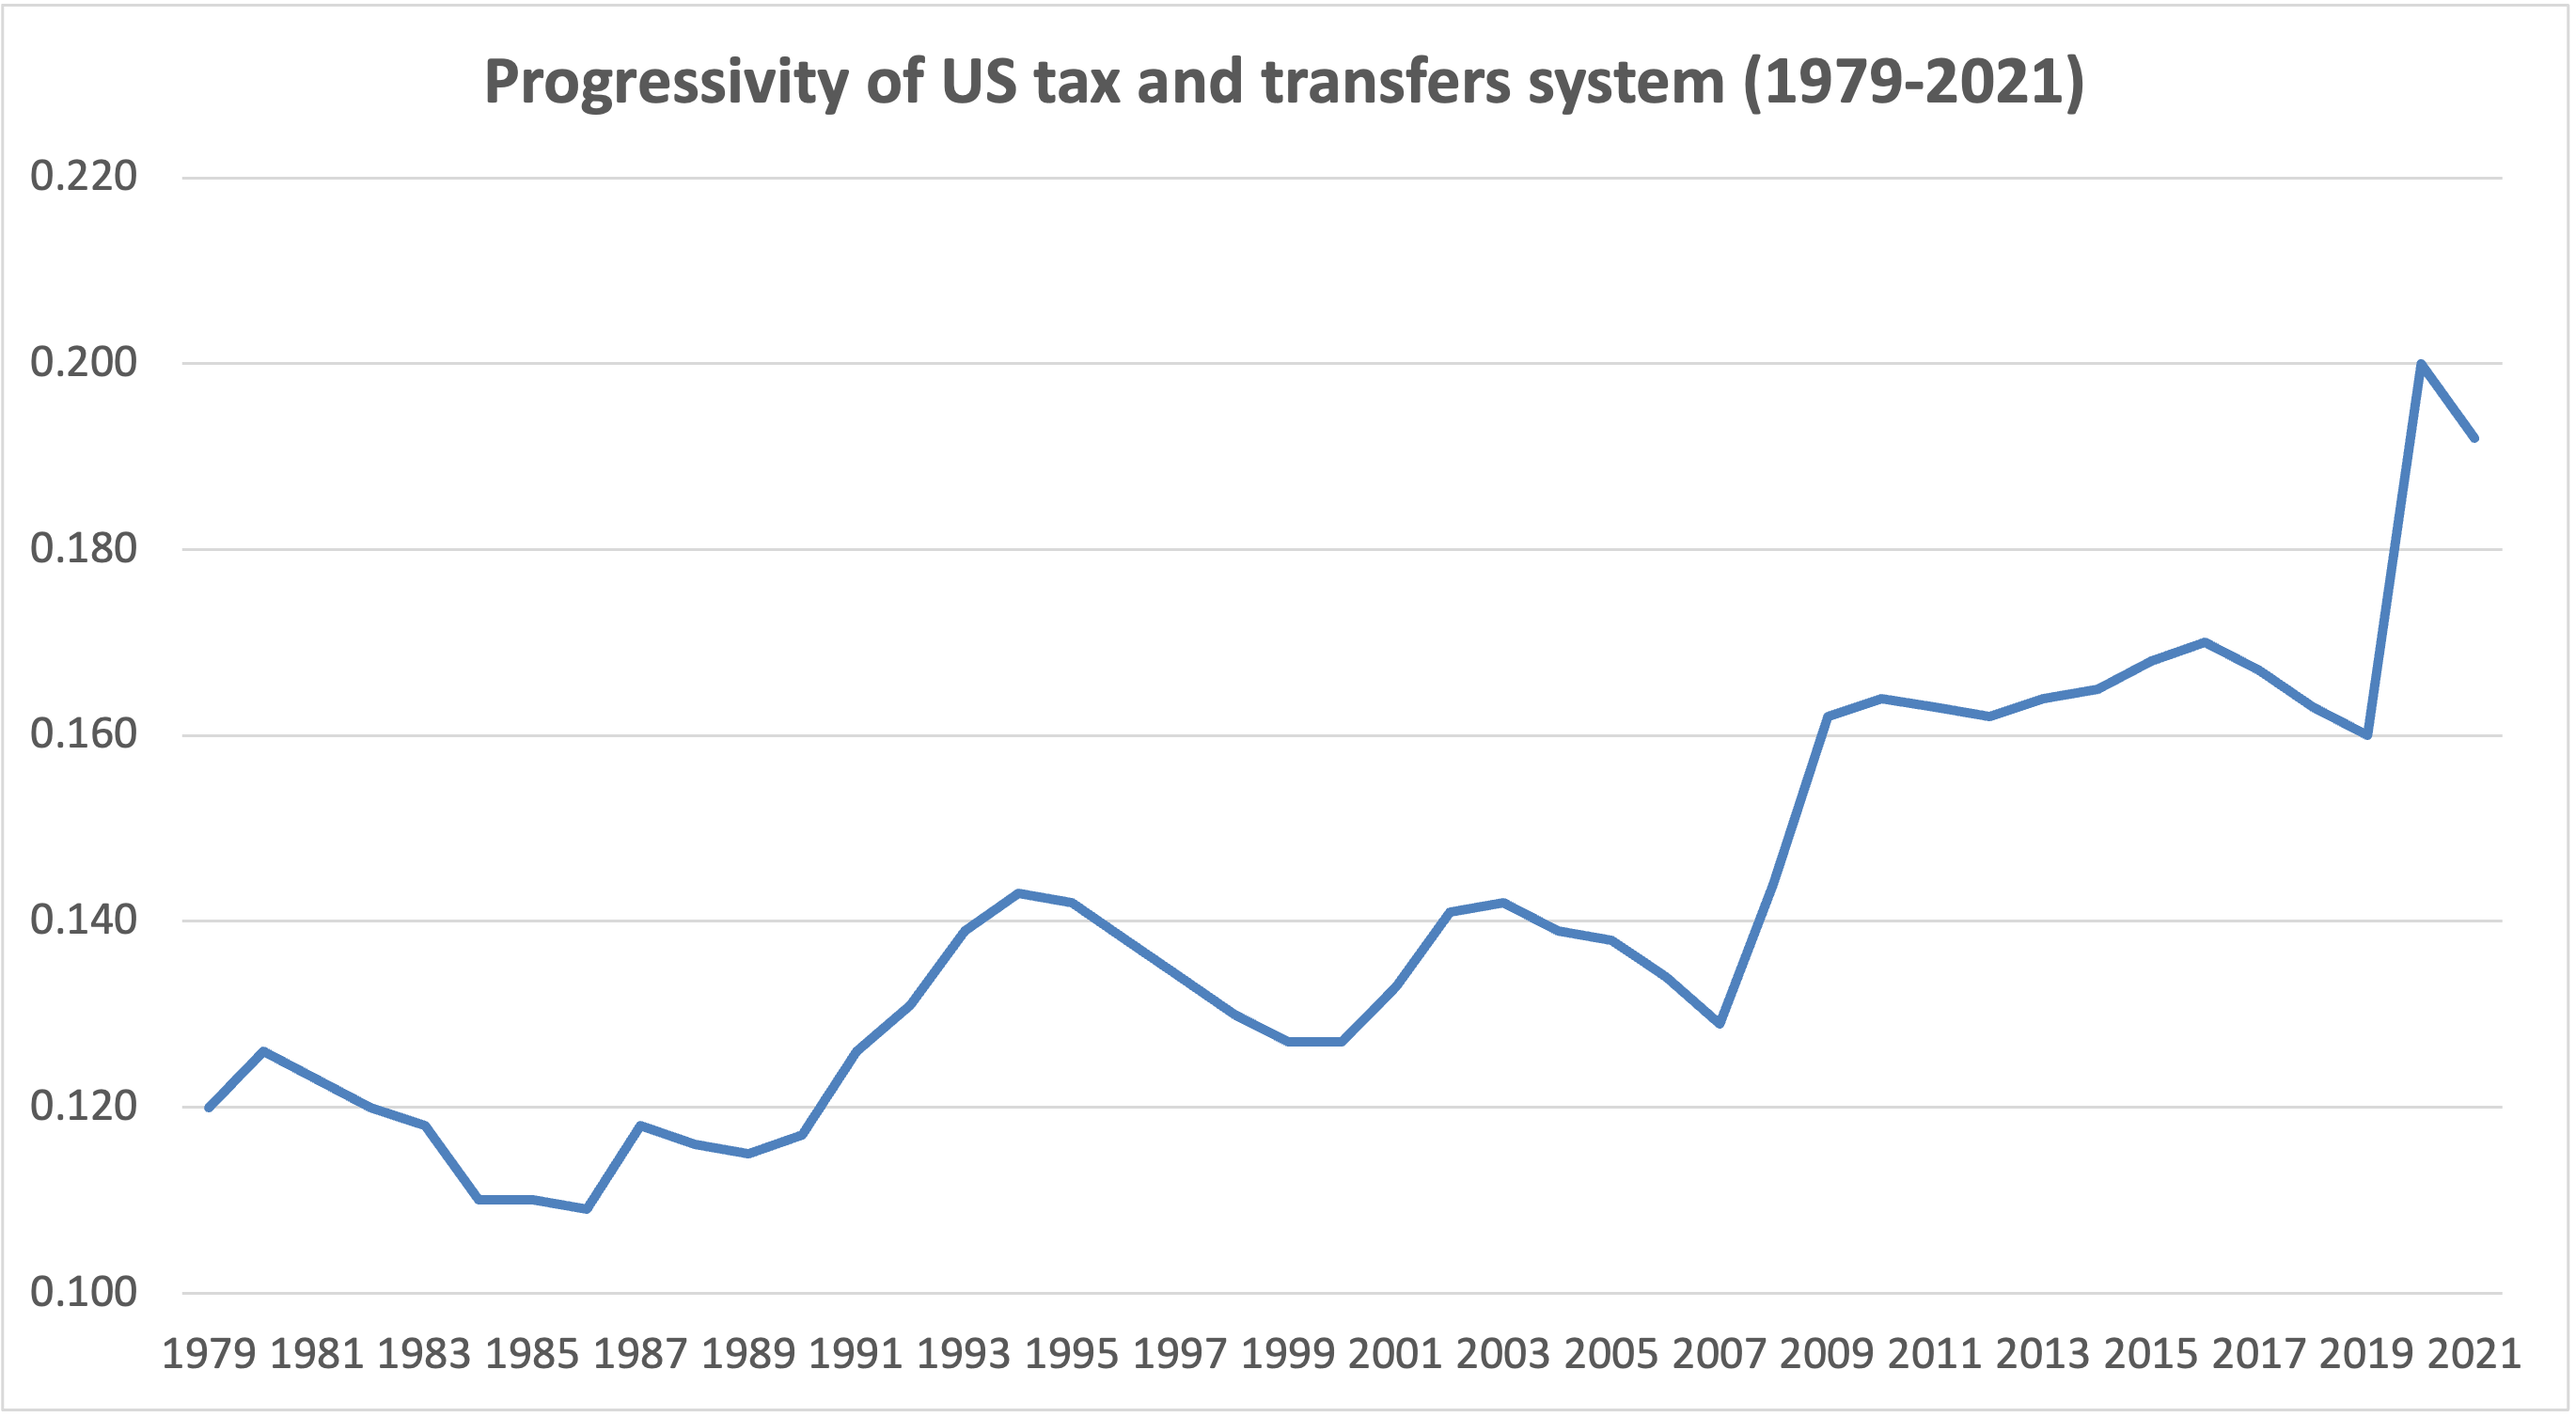
Source: Congressional Budget Office, “Trends in the Distribution of Household Income From 1979 to 2021”, September 2024.
The progressivity of US taxes and social transfers has increased, offsetting the rising inequality in market outcomes1. To get a sense of how progressive the US tax system is, consider the following numbers from a recent Tax Foundation report (data are for 2021):
the top 1% of taxpayers pay nearly 50% of all federal income taxes; they account for about 25% of total adjusted gross income;
the top 5% pay nearly 70% of all federal income taxes; they account for just over 40% of total adjusted gross income;
the top 50% pay 98% of federal income taxes; they account for nearly 90% of total adjusted gross income;
the bottom 50% pay about 2% of taxes; they account for 10% of total adjusted gross income.
Is this progressive ‘enough’? Is it ‘fair’? That’s a difficult value judgement. Let’s dig some more.
Surprise!
How does the US compare to Europe? Here it gets interesting. Let’s take the difference between Gini coefficients on market income and disposable income as a measure of income redistribution:
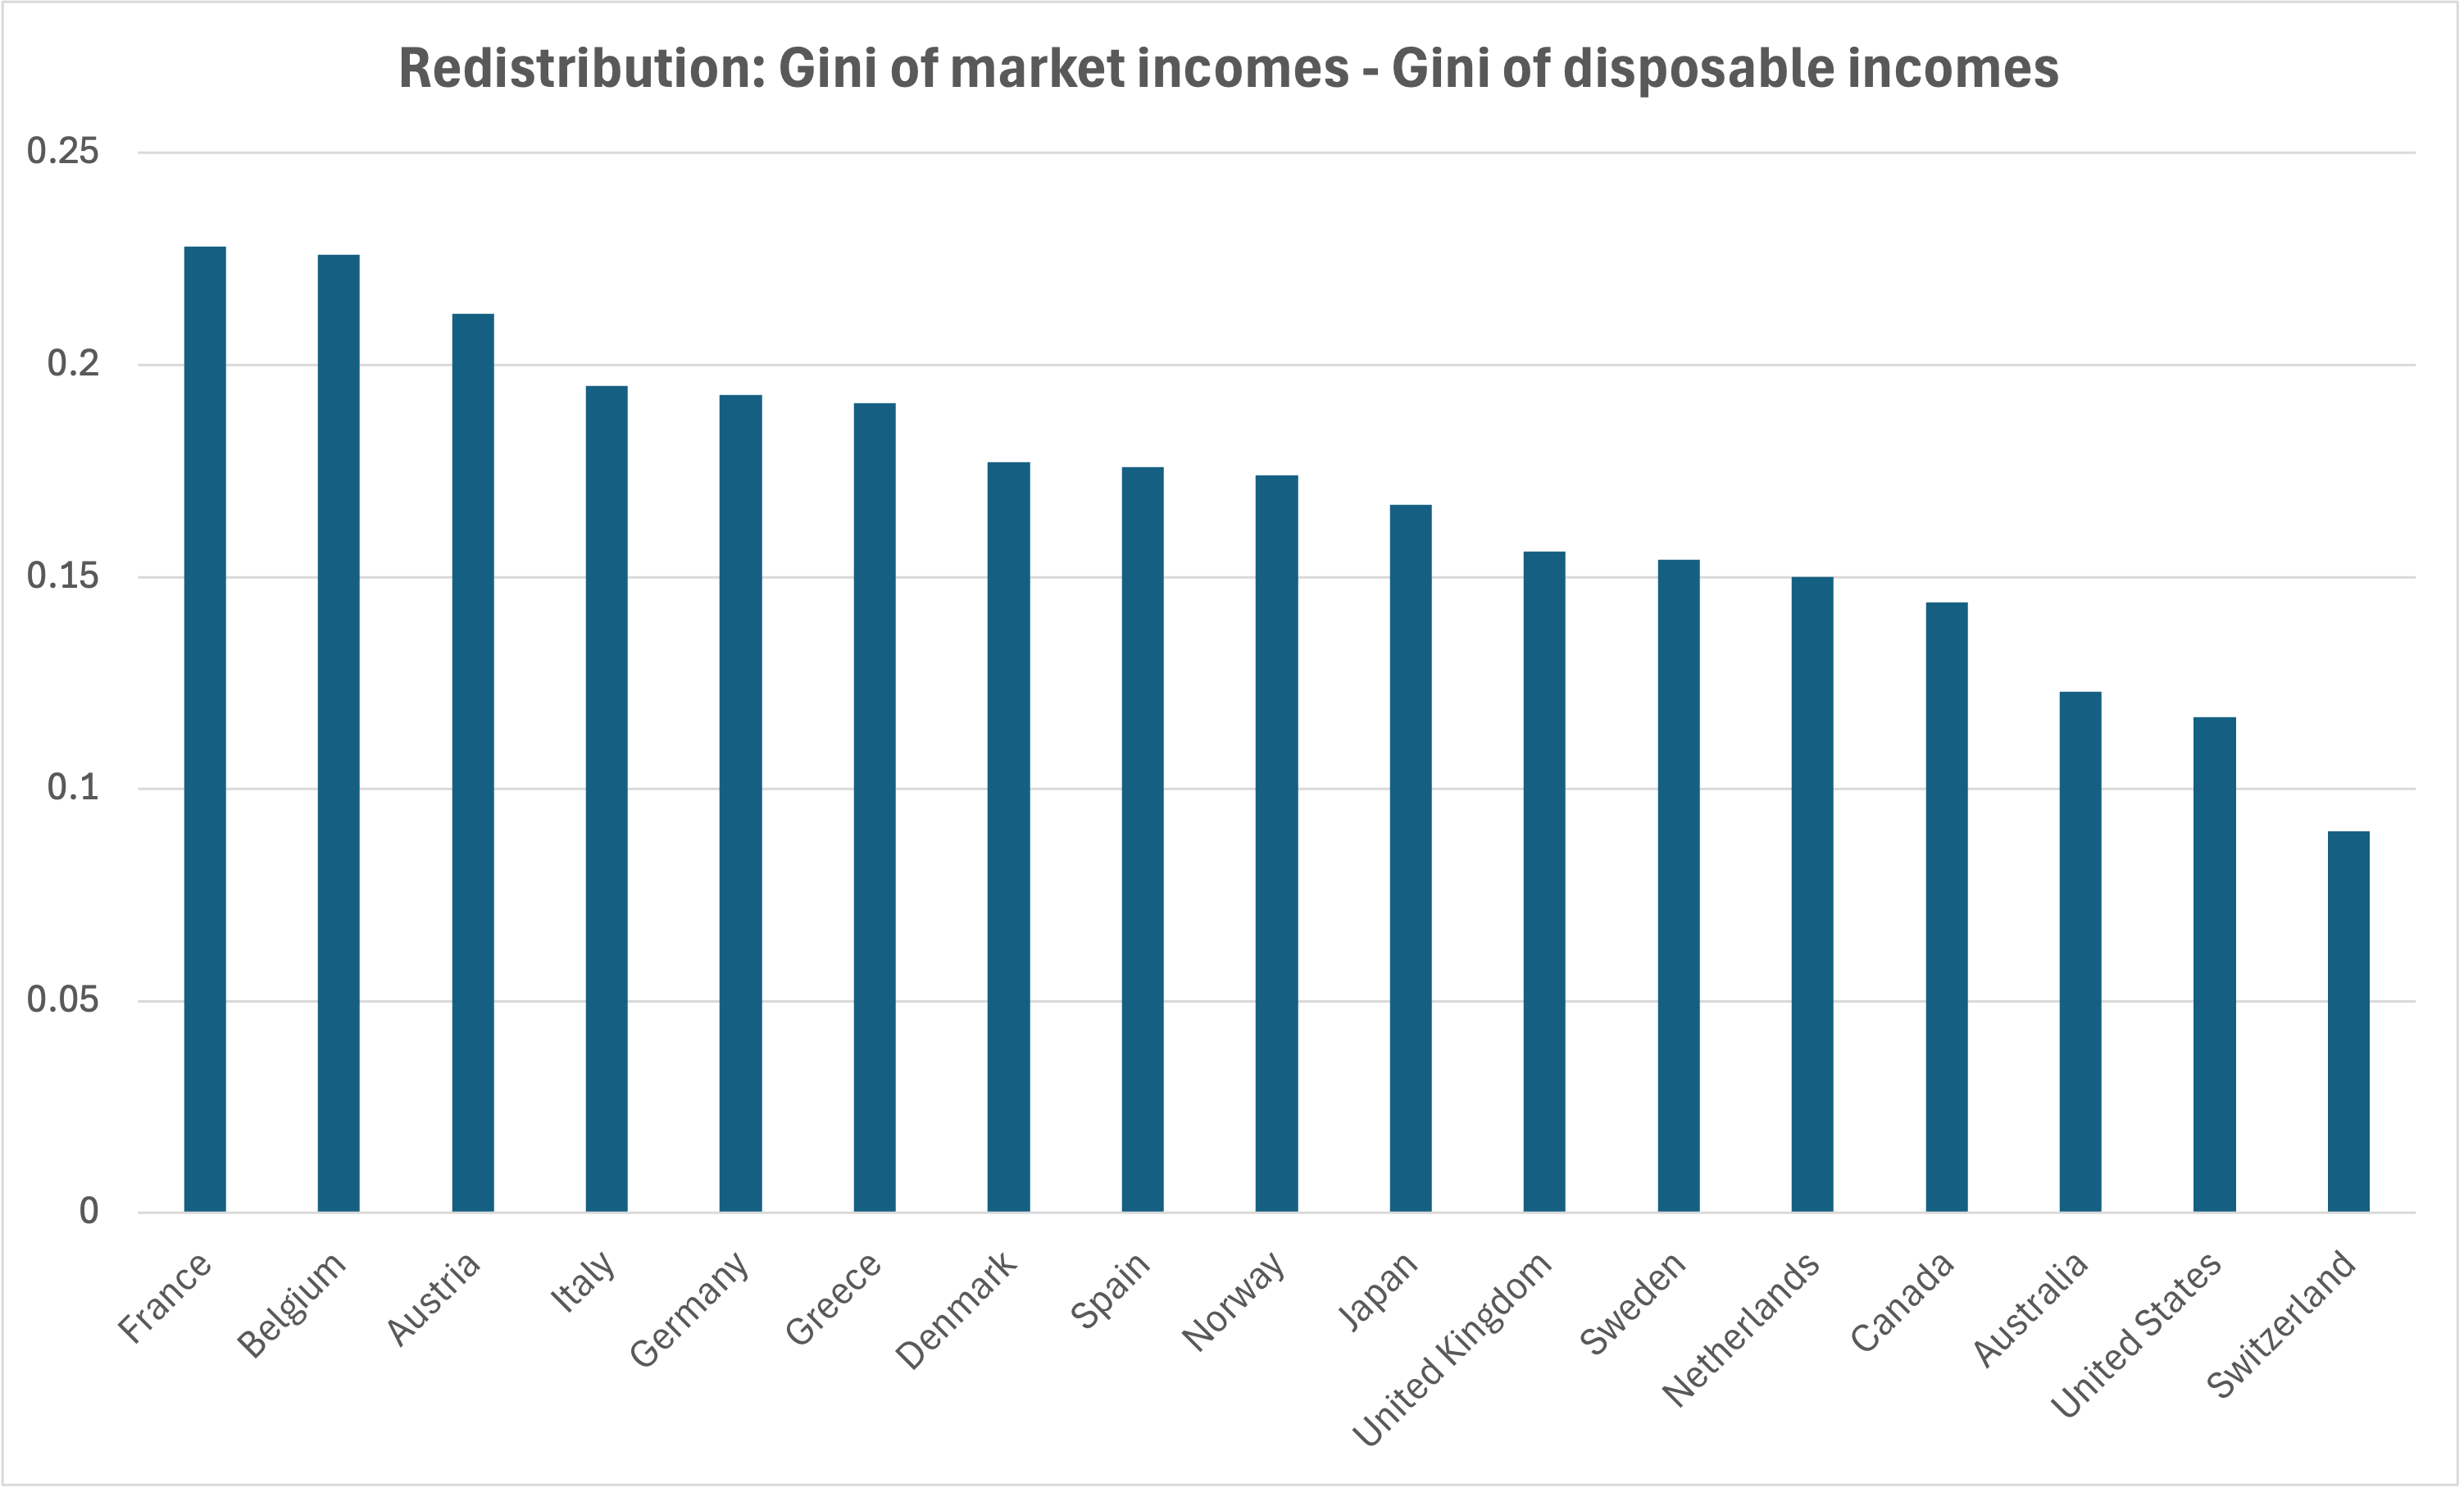
Source: OECD via Our World in Data
Based on this measure, there seems to be more income redistribution in most European countries than in the US. But…a 2022 academic study finds that
the US redistributes a greater share of national income to low-income groups than any European country. 2
That’s surprising. How can this be?
Government giveth, and government taketh away.
Because Europe relies heavily on consumption taxes (chiefly VAT), which have a disproportionately adverse impact on low-income people, but are not included in the disposable income calculations for Gini coefficients.
In addition, traditional Gini measures are based on survey data, which tend to underestimate top incomes and underestimate market incomes inequality more in the US than in Europe — remember the chart above where France and Italy have higher inequality of market incomes than the US? This study instead uses a methodology that combines survey, tax and national account data, capturing indirect taxes, corporate taxes, undistributed profits and imputed rents.3
European governments reallocate more money to lower income citizens with one hand (via social transfers), but take it away with another (consumption taxes) and end up with a less generous redistribution system than the US.4 We (economists) know that consumption taxes are regressive, because lower-income households spend a much greater proportion of their income. Here you see the distributional impact. Therein lies the paradox: Europe, with much higher taxes and a more generous social welfare system, ends up redistributing less purchasing power than the US.
However, since the US economy delivers a more unequal distribution of market incomes, the US still ends up with greater income inequality. 5
Better to be all richer, or to be more equal?
Is there too much inequality in the US? If so, should the government try even harder to correct it with higher taxation and more generous social transfers? Or should it try to change the distribution of market incomes? The latter is affected by education, minimum wages, wage negotiations mechanisms, international trade, technological change, taxes and transfers (see this article for references to the economic literature).
they can never pay me as little as I can work
How much inequality is acceptable is an ethical question for society. But a related question is the extent to which measures to cap inequality can restrain growth in overall living standards.
We are driven by incentives. When more of our income is taxed and redistributed, we have less incentive to perform. The best example is communism. When I worked on former Soviet Union countries at the IMF, someone who’d lived under communism said: “they can never pay me as little as I can work.” In a less extreme context, this helps explain why America is richer than Europe. Average real incomes in the US are over 20% higher than in Germany, nearly 40% higher than in France and nearly 50% higher than in Italy.
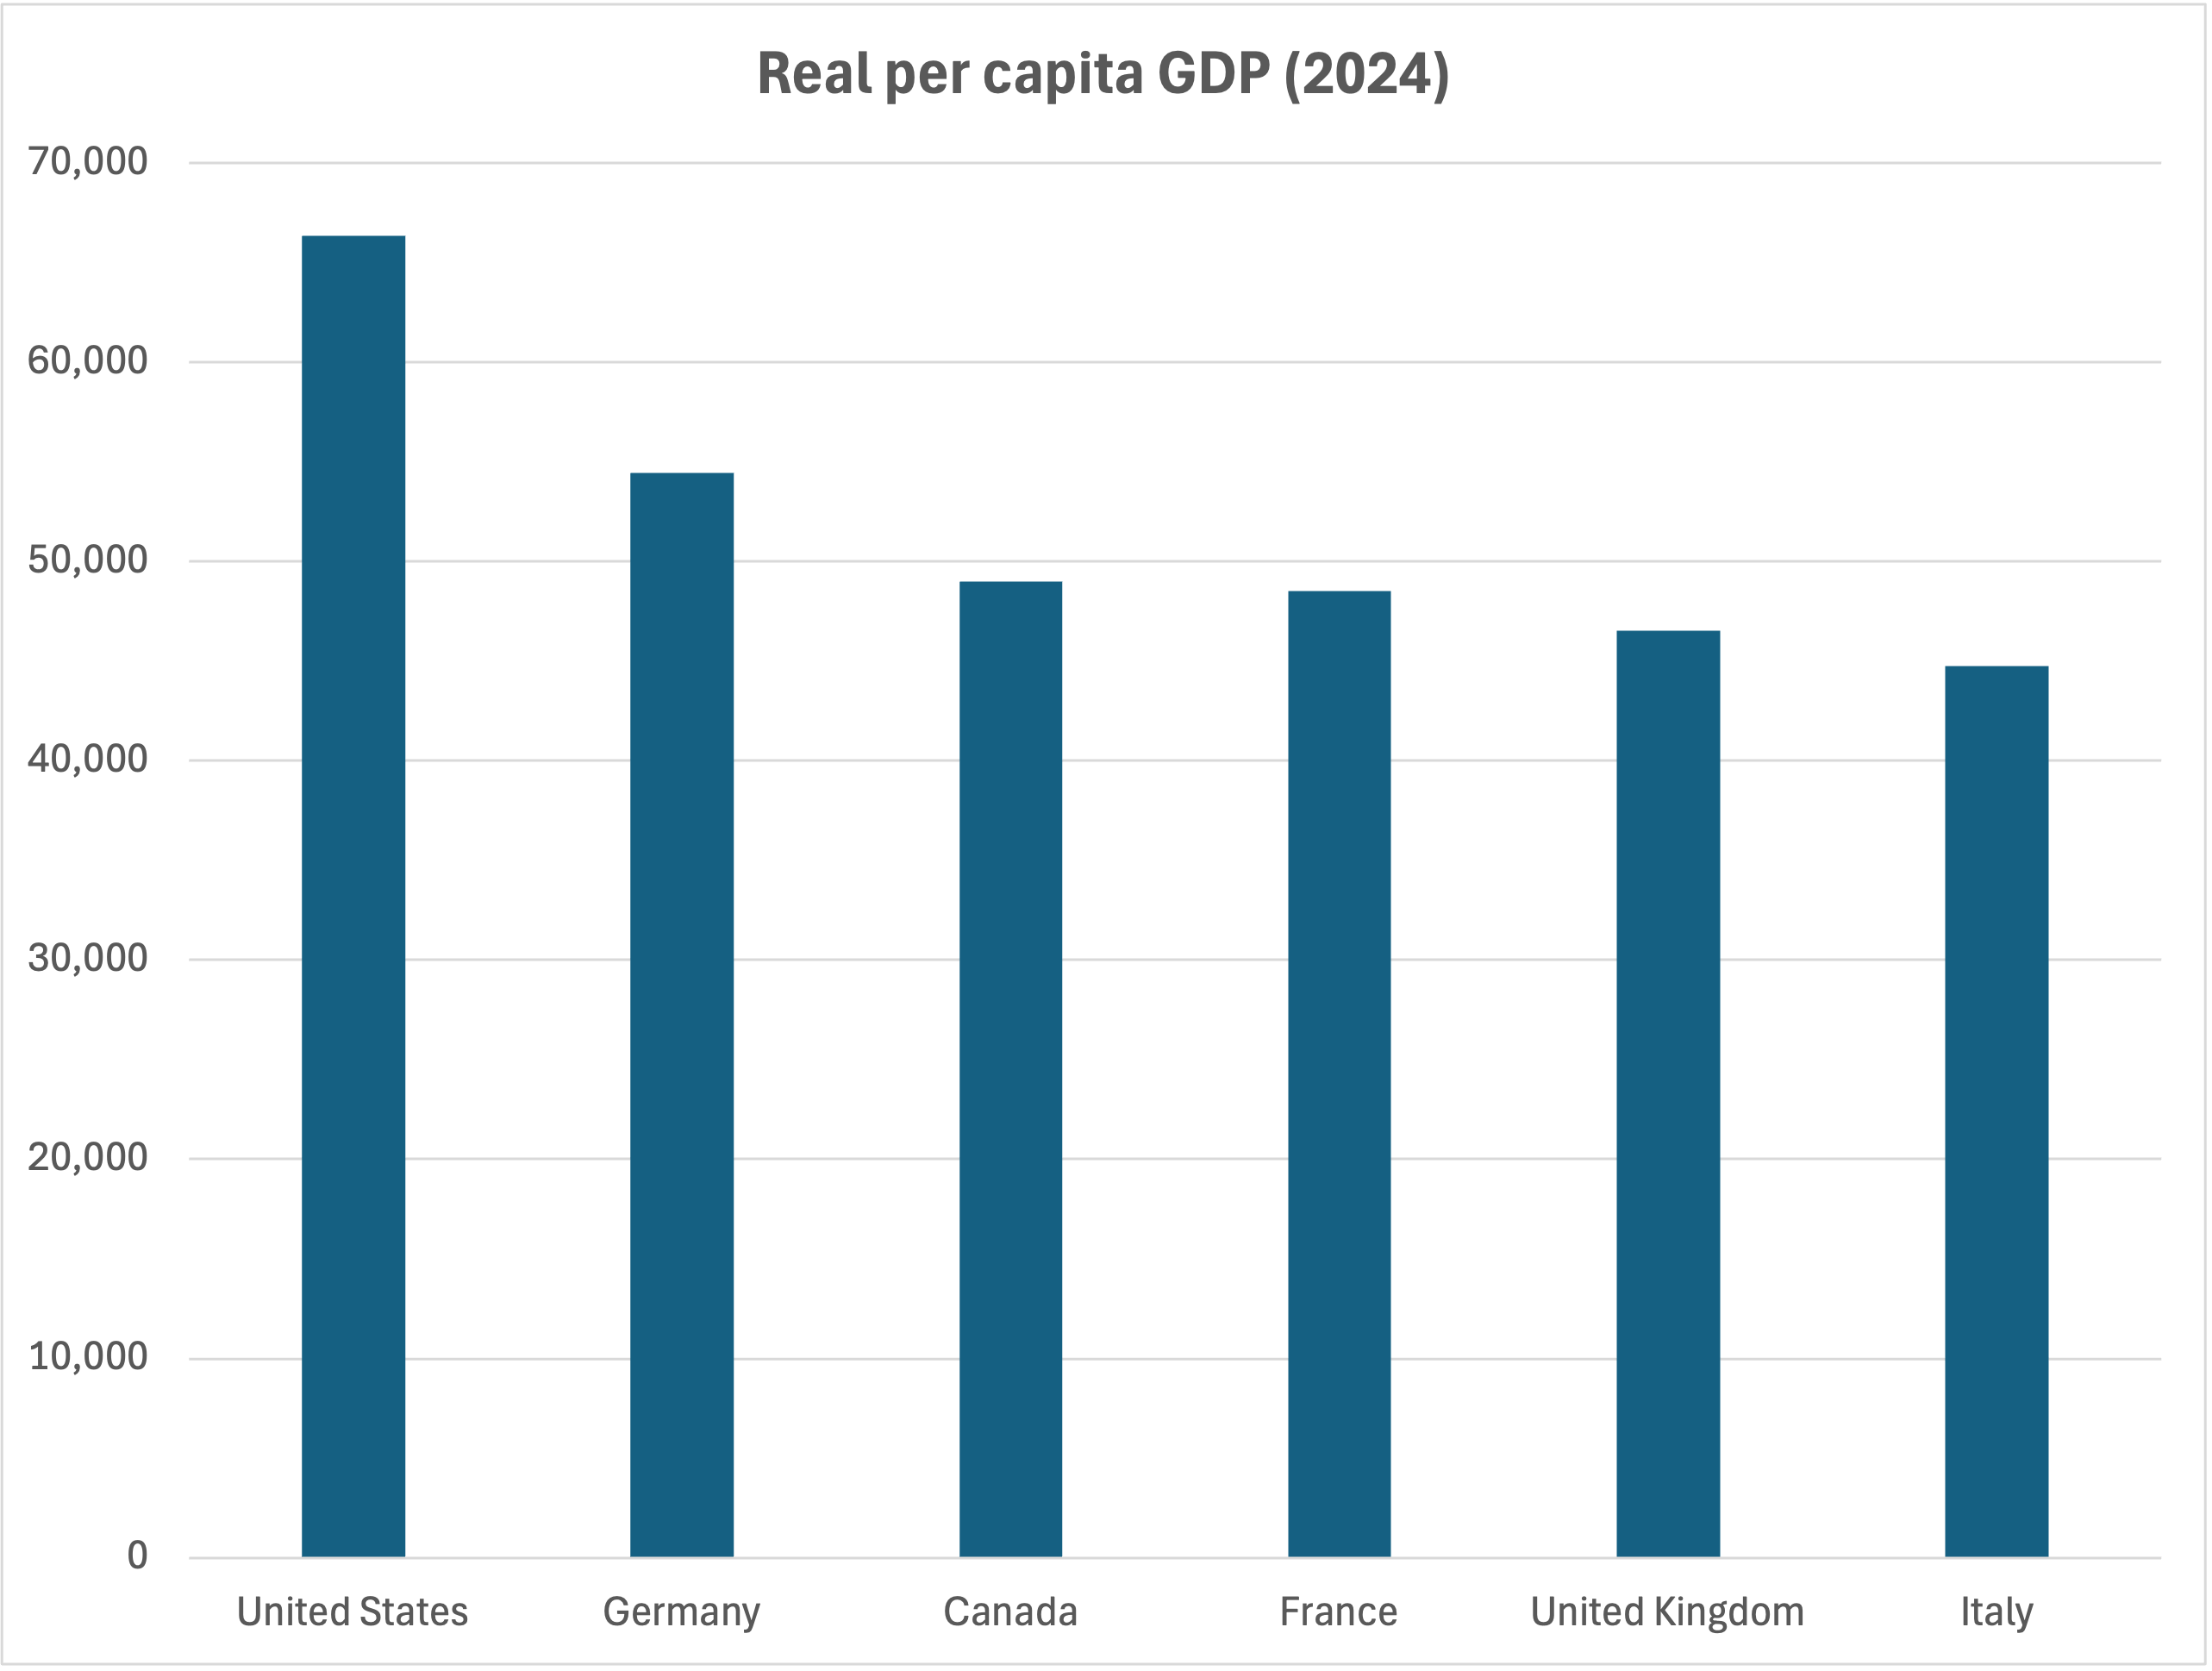
Source: IMF
Ok, Americans are much richer on average, but given the greater degree of inequality, are lower-income households in the US poorer or richer than their European counterparts? A 2019 study by Just Facts finds that
the poorest 20% of Americans consume more goods and services than the national averages for all people in most affluent countries.
The study includes all in-kind social transfers, and so measures the actual ability to consume rather than income. It seems that you are better off being poor in America rather than in Europe or pretty much anywhere else. 6
This leads to an interesting observation: Europe’s income redistribution strategy appears far costlier in terms of foregone economic growth: high taxes and a generous welfare state contribute to slower income growth, leaving everyone worse off. However, it does deliver a more equal income distribution. The actual extent of redistribution is smaller than in the US, because to finance a large welfare state you need to tax consumption, which hurts the poor more than the rich. But in the process you reduce inequality of market incomes and end up with a more equal distribution of disposable incomes.
Is greater equality worth reducing everyone’s purchasing power? Is it better to be all richer, or to be more equal? The answer depends on society’s preferences, but this seems to be the trade-off at stake. With one important exception: improving education could help reduce inequality in market incomes without negative impact on work incentives.
Individual generosity vs. government largesse
One last thing: at the individual level the “ugly Americans” are a lot more generous: they give a lot more to charity — seven times as much as Europeans, on a per capita basis, and they engage in volunteer work at a much higher rate. My interpretation is that Europeans think the government will take care of helping those in need — not an unreasonable expectation given the size of the public sector. Americans feel much greater individual responsibility.
Five takeaways
As I brace for the usual wave of colorful criticism, I hope you’ll take away five thoughts from this blog:
Measuring inequality and comparing it across countries is harder than you might think, so always take a closer look, don’t stop at the soundbites. Remember there’s a lot of uncertainty in the estimates.
The most surprising result is that redistribution policy is more generous in the US than in Europe. This goes straight against conventional wisdom, and it is because European governments spend so much money that they have no choice but to raise it with consumption taxes, which hurt the poor more than the rich. As I wrote in a previous post, it’s always your money they’re spending.
The US still ends up with greater inequality than its peers — here the conventional wisdom is right.
How much inequality is acceptable remains a difficult choice for each society to answer.
Equally difficult are the trade-offs at play: measures taken to reduce inequality can lower income growth for everyone. Greater equality might be worth it, but let’s remember the trade-off. Similarly, there is a trade-off between social and individual responsibility.
I look forward to your thoughts and reactions.
Opening image credit: Photo by Markus Spiske on Unsplash
The jump in 2020-2021 redistribution reflects the massive Covid-related programs.
“Why Is Europe More Equal than the United States?” By Thomas Blanchet, Lucas Chancel, and Amory Gethin, American Economic Journal: Applied Economics 2022.
An additional complication relates to pensions: While you are working, the government takes money from you in the form of social security contributions; when you retire, it gives it back to you as a pension, recorded as a social transfer. Classifying all this as redistribution from richer to poorer people is a stretch. So if a country has more pensioners and a more generous pension system, this artificially inflates the Gini measure of redistribution. There is of course some degree of genuine redistribution in the pension system as well.
The study also stresses the weaknesses and inconsistencies in existing data: for example, inequality measures rely on surveys, which tend to underestimate high incomes. It’s worth reading the article’s introduction just to get a sense of how much uncertainty there is in the numbers, and the resulting scope for confusion.
The paper notes that inequality before and after taxes has increased in Europe as well, but not as much as in the US.
Ideally I would like to compare real incomes for the bottom 20% of households across countries; but while I have data for the US, I cannot find them for any major European countries (I’d love a reference, if anyone has it).
Do you think that we need to look beyond disposable and into discretionary income? Inequality is felt at the discretionary income level, and missing in the data you provided are costs such as housing, medical expenditures, transportation, etc. Drawing conclusions on “Inequality” by solely looking at “Inequality of Income” seems a bit insufficient, but curious what others think
Very interesting, although I struggle to agree with the conclusion that higher inequality leads to higher growth, otherwise Venezuela and North Korea would be the paradigm of economic growth, hahaha! Is more likely that the inequality of economic growth between EU and US is due to many factors, including generous welfare state, like unified rules, markets, a culture of risk taking, etc