

We Are In Your Debt
We Are In Your Debt
Governments went on a spectacular borrowing binge over the past fifteen years; they have little to show for it.


Image generated with DALL-E: “an unstable tower of US dollars falling over a city”
Governments have enthusiastically ramped up public debt during the past decade and a half. I thought most of us would appreciate the consequences; it does not take a PhD in economics to understand that living beyond your means can be hazardous.
Debt for dummies
Then I noticed the International Monetary Fund has posted a video on public debt. I watched it, and my heart sank. We’re in trouble. The video is part of a series aptly called “Back to Basics,” though watching it I wondered about the “Back”part, because the video seems aimed to an audience that never had any exposure to the basics in the first place.
In the obligatory cartoonish style, with magically appearing and disappearing objects and an infantilizing script, the video explains that you should not borrow more than you’ll be able to repay, and that when you borrow money you should spend it wisely — especially if you are a government. You would think to most people this would be obvious. Apparently not.
The IMF is probably trying to help improve economic and financial literacy in the broader population, a laudable goal. Perhaps it should also send the video to economic policymakers around the world, and maybe discuss it in the context of its regular Article IV consultations.
They told us to borrow more…
Here are some numbers — let’s look at a sample of advanced economies.
In 2007, before the Global Financial Crisis, only Greece and Italy had a government debt ratio above 100% of GDP, and barely so (104%); Belgium followed with close to 90%; the US, Canada, France, Germany, and Austria were in the mid-60s; the UK was just over 40%. (The crayon colors look a bit childish, but they help compare countries’ positions across the two charts.)
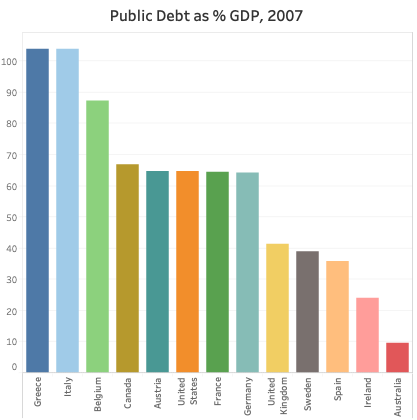
Source: IMF, World Economic Outlook database
Now fast-forward to the end of last year (IMF estimates from the latest World Economic Outlook database): Greece’s debt has nearly doubled, to 180% of GDP; Italy’s has gone up by half, to about 150%; the US has overtaken Belgium and other major European economies, with a debt ratio above 120%, nearly double the level of fifteen years ago. Spain’s debt ratio has increased nearly four-fold; most other countries have also registered a strong rise in debt, with the notable exceptions of Germany (only an additional 7 percentage points) and Sweden, which actually reduced its debt ratio over the period.
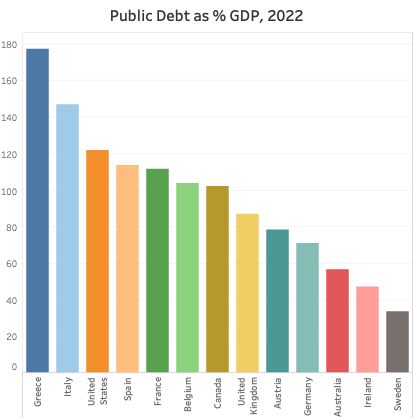
Source: IMF, World Economic Outlook database
Japan stands in a class of its own, so I have left it out because it would distort the charts: in 2007 Japan already had a debt ratio of over 170% of GDP; by the end of last year it had ballooned further to over 260% of GDP.
Prominent economists had been arguing that with interest rates at record low levels governments would be stupid not to borrow with abandon. Most governments, apparently, listened.
No bang for the borrowed buck
Higher debt, however, did not appear to bring greater prosperity. For the next chart I have taken real GDP per capita, measured in Purchasing Power Parity terms, and I have normalized it setting the 2007 level equal to 100 for all countries. This way, the chart shows you to what extent real incomes have increased in the various countries over the fifteen year period.
It is not a pretty picture. Greece, Italy and Spain, all of which accumulated a lot of new debt, have fared especially poorly: Italy’s average real income is 5% lower than it was fifteen years ago; Greece’s is almost 20% lower; Spain is barely even.
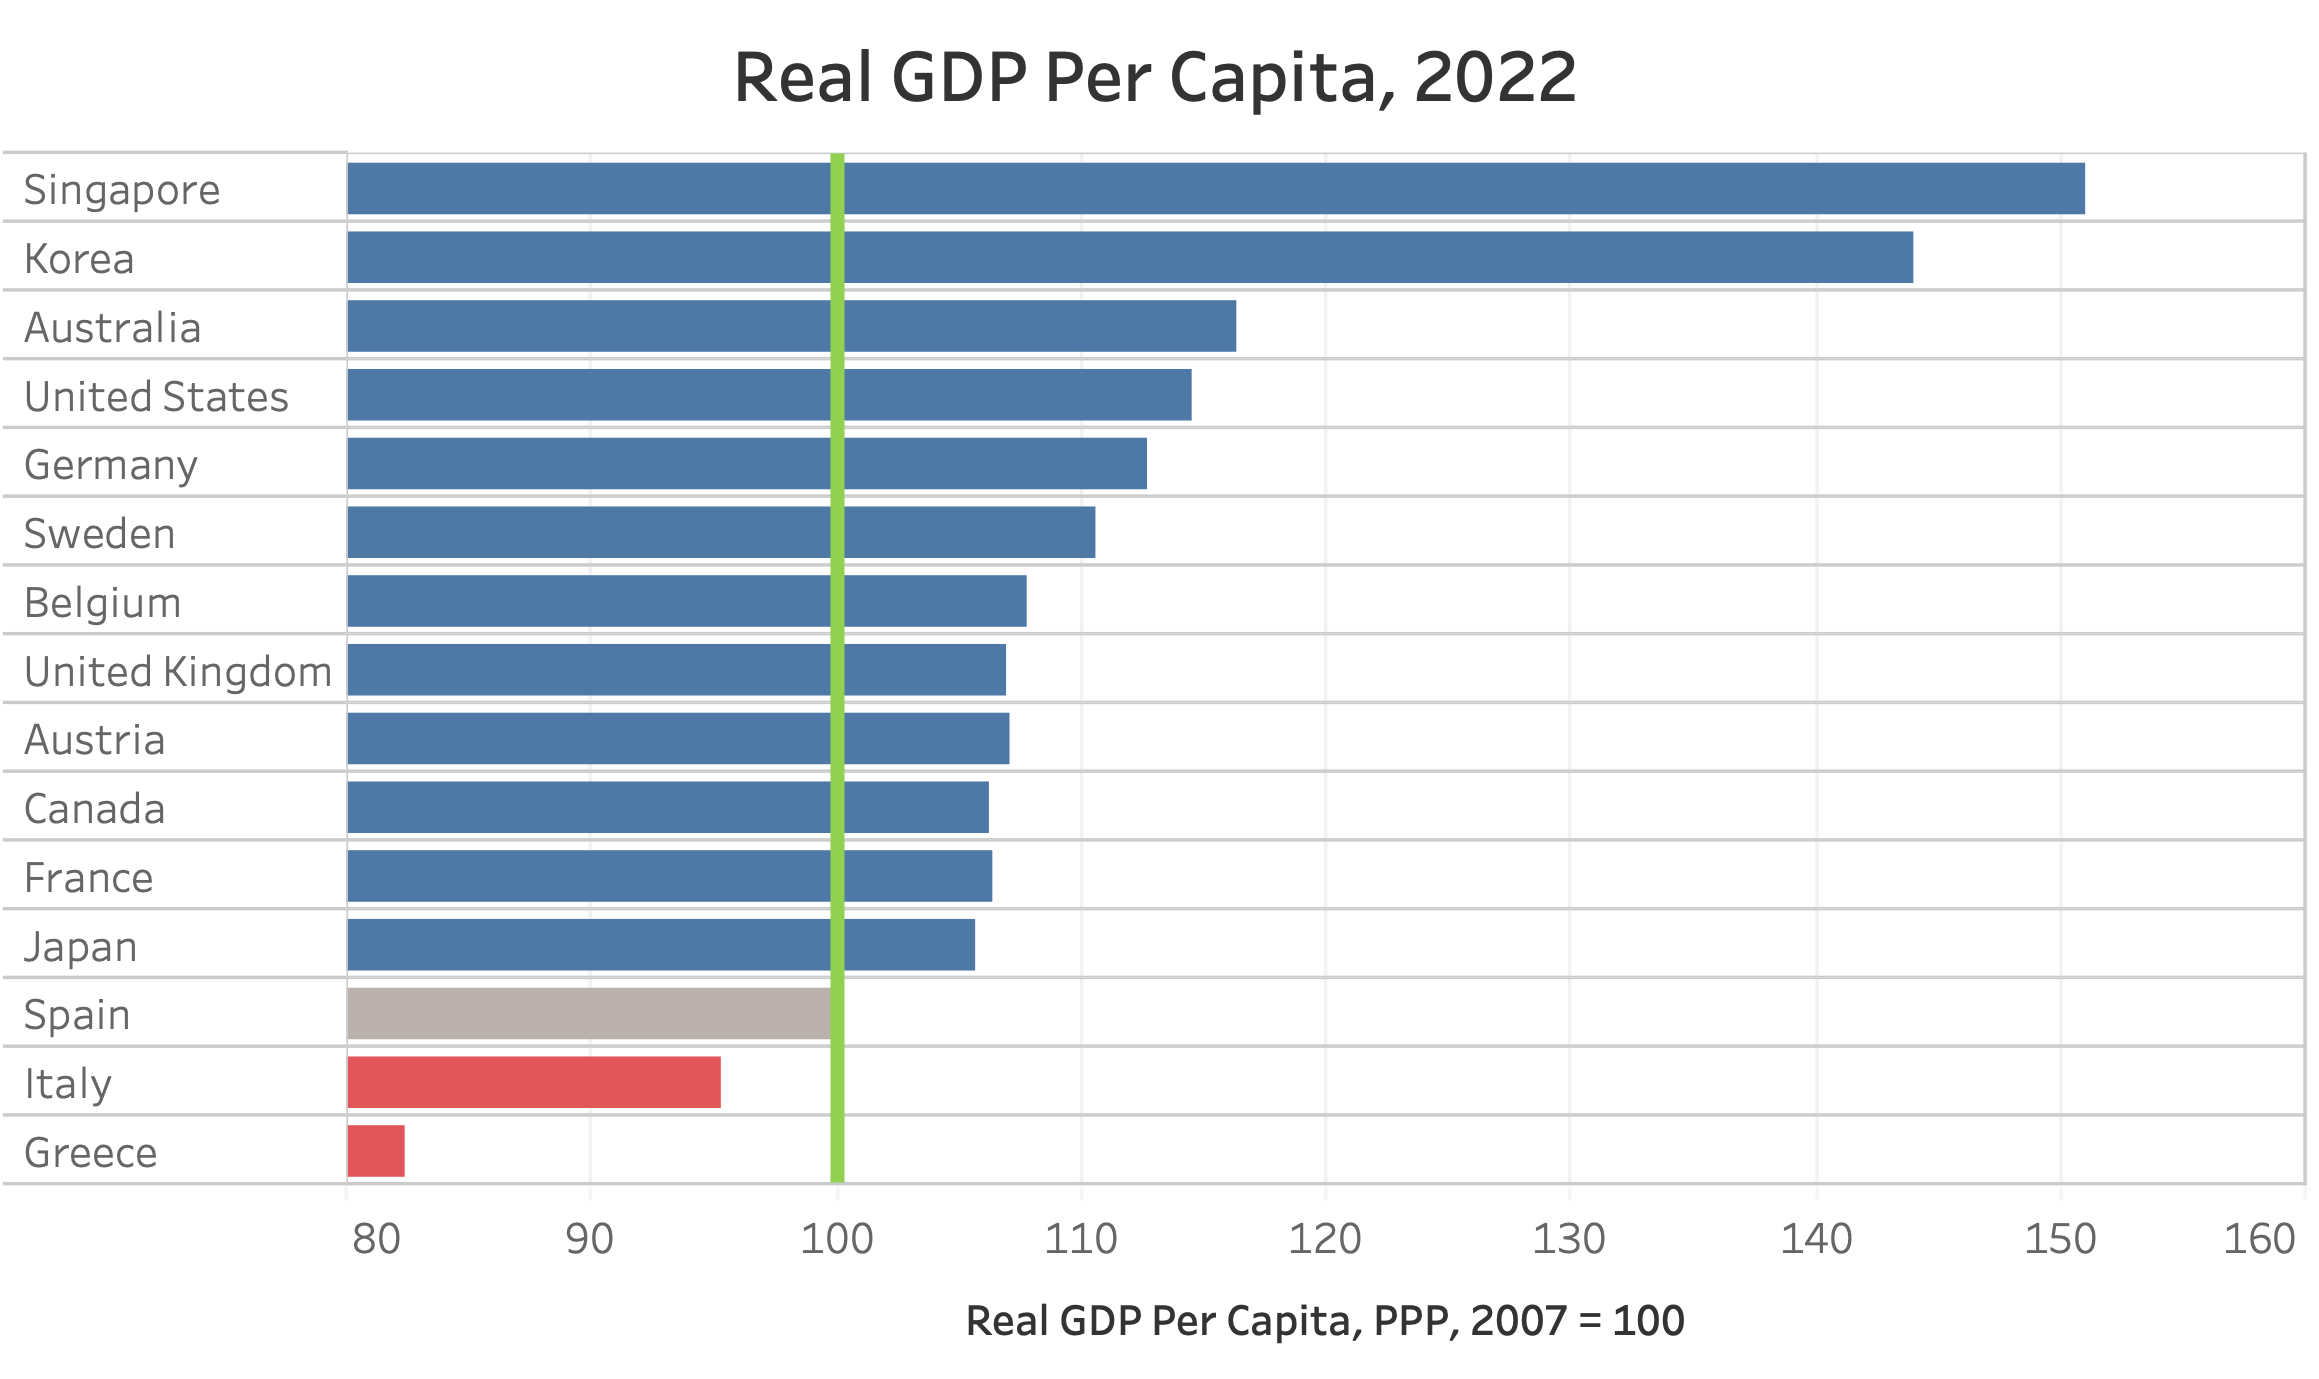
Source: IMF, World Economic Outlook database
I am not claiming that running up debt necessarily makes you poorer; higher public debt can be the result of economic hardship as governments cushion the impact of economic downturns, and southern European countries have suffered extra hardship over the period, notably the during the Eurozone’s debt crisis. Though, come to think of it, the reason why they came under pressure was exactly the markets’ rising concern for their credit-worthiness, so high debt was not just a consequence but also a cause.
Other countries did not exactly shine either: real per capita GDP rose by about 15% in Australia and the US; that’s a meager 1 percentage point per year. Germany’s rise was even lower, 13%; most other countries in this sample saw their average real incomes rise by a measly 6-7%.
Note that Sweden, which actually reduced its debt ratio over the period, experienced a rise in income close to Germany’s. (What is it about Sweden, by the way? This is the same country that went against the global Covid lockdown consensus and ended up with better health outcomes than many others. Annoying, no?)
To remind ourselves that incomes can rise quite a bit faster, I have included Singapore and Korea, whose real per capita GDP rose by 50% and 44% respectively. Singapore’s debt increased from about 100% to about 140% of GDP, while Korea's rose modestly from under 30% to just over 50% of GDP.
So, most of the countries that took advantage of lower rates to spend and borrow more did not gain much in terms of higher living standards.
A bright future behind us
What if we look forward? The IMF video preaches that governments should invest borrowed money in infrastructure, education, health and other outlays aimed at raising their economies’ growth potential.
For the next chart I have taken the average real growth rates for the decade prior to the Global Financial Crisis (1998-2007) and compared them to the average growth rates that the IMF is projecting for the 2024-2027. I am taking these projections as baseline expectations for the current growth potential of these economies — rather than using an average of the latest years, which would be biased by the pandemic and the impact of the monetary policy correction.

Source: IMF World Economic Outlook database
Once more, not a pretty picture. For most countries the growth potential seems to have declined substantially, with the only exception of Germany, which is expected to expand if anything at a slightly brisker pace.
Again, I am not arguing that higher debt necessarily causes slower growth. The bulk of the deceleration reflects a slowdown in productivity that started just before the Global Financial Crisis.
But it certainly seems that none of all that extra borrowed money has been invested in a way that will generate stronger growth.
Slower economic growth makes it harder to service and eventually repay the debt — so taking on a lot more debt and ending up with lower growth prospects sounds rather counterproductive. This is becoming especially obvious now that interest rates have risen. If rates settle at a significantly higher level than the past decade — as I think is likely — higher debt ratios will prove to be a much heavier burden than governments thought, constraining fiscal policy and increasing financial vulnerability.
Unrestrained borrowing has neither boosted prosperity nor paved the way for faster future growth. Maybe we should give it a rest. Let’s watch that cool IMF video again…
As usual, very well written. Surprising how some of the smartest people in the world can get things so wrong so many times!
Completely on another tangent, I would love to read your in depth analysis on the data beginning to trickle out of the UK and other countries on the gigantic vaccine scam that seems to have been hushed up by big Pharma and it’s supporters. I just read today an article by Alex Berenson from his blog Unreported Truths that data finally released by the British government (apparently it was known since last October) show very similar rates of Ovid hospitalisation amongst vaccinated & unvaccinated people in most age groups.